Implicit vs explicit syntax#
A common source of confusion is the difference between explicit and implicit plotting syntax in matplotlib. This is the difference between using ax.plot() notation (explicit or object oriented syntax) versus using plt.plot() (implicit or procedural syntax). The explicit syntax tells matplotlib exactly which set of axes you’d like to place the plot (in this case ax). Implicit syntax assumes which axes you want to add the plot to, and in this case, it would be the last axes that you created or used. You’ll often see the implicit syntax in tutorials and Stack Overflow discussions, however, I strongly encourage you to use the explicit syntax to avoid confusion, especially in cases when you’re creating subplots.
Let’s take a quick look at an example of what happens when you try to use implicit and explicit syntax in a situation with subplots using the data below. Let’s say we want to plot y1 on a plot on the left and y2 on a plot on the right
# Create some data to plot
x = [1, 2, 3, 4, 5]
y1 = [1, -2, 3, -4, 5]
y2 = [0, 2, 4, 6, 8]
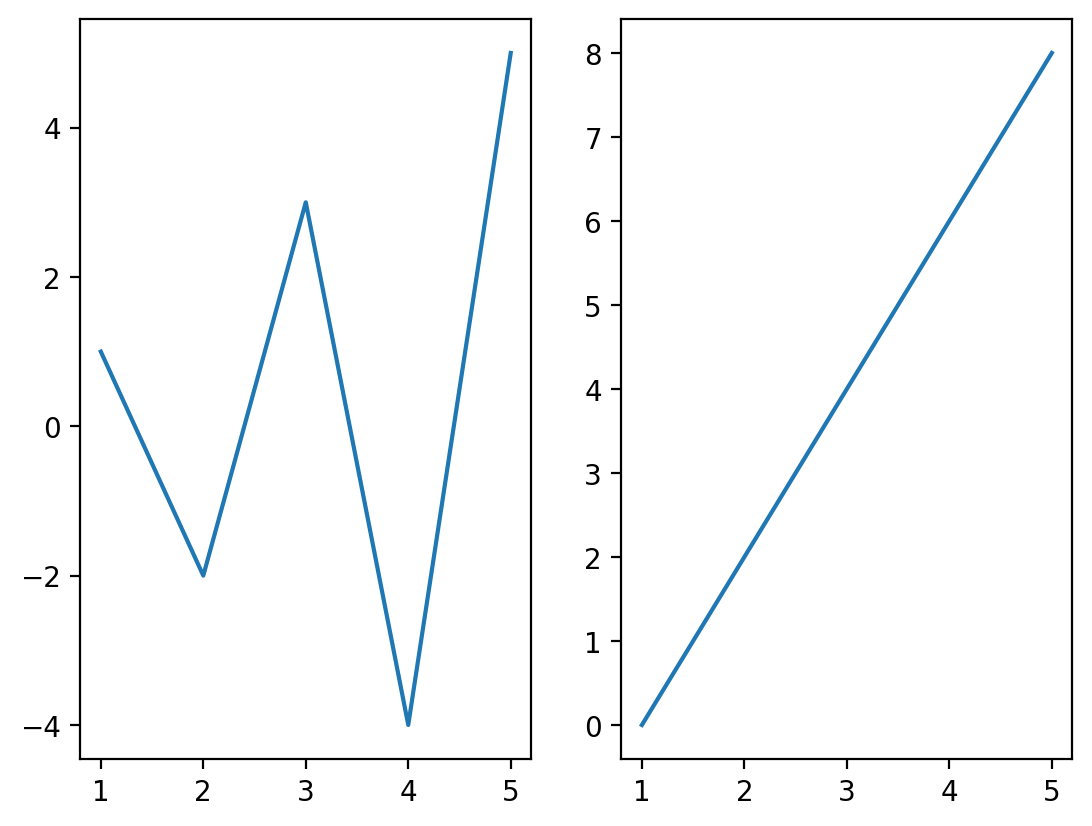
Let’s start with the explicit syntax - we create a plot with two subplots and plot each on the corresponding axes:
%config InlineBackend.figure_format = 'retina'
import matplotlib.pyplots as plt

fig, (ax1, ax2) = plt.subplots(1, 2)  # nrows, ncols of axes
ax1.plot(x, y1)
ax2.plot(x, y2)
plt.show()
Now, let’s repeat this using implicit syntax following the same formula:
fig, (ax1, ax2) = plt.subplots(1, 2)  # nrows, ncols of axes
plt.plot(x, y1)
plt.plot(x, y2)
plt.show()
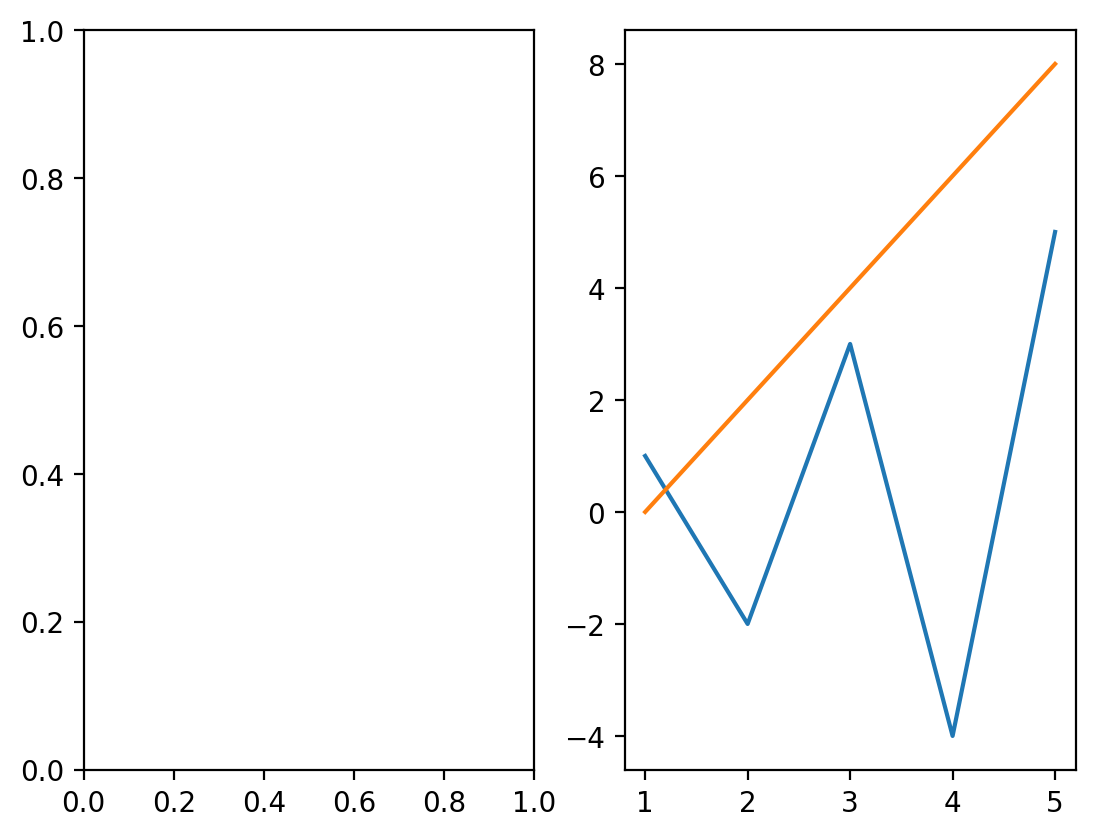
What happened here? In this case, matplotlib created the left axes first, then the right axes, so the last axes that was created was the one on the right. Therefore, the implicit syntax (plt.plot()) assumes you want to plot things on the last plot used, hence you get the two plots of y1 and y2 on the same set of axes. To correct this, you have to make the axes you want to plot on become “active”, which can be done using plt.sca(). However, this is cumbersome, as shown below. Using the axes-centered explicit syntax removes any potential ambiguity from your code which becomes even more challenging when you begin customizing plots.
fig, (ax1, ax2) = plt.subplots(1, 2)  # nrows, ncols of axes
plt.sca(ax1)
plt.plot(x, y1)
plt.sca(ax2)
plt.plot(x, y2)
plt.show()
Again, we strongly recommend that you use the explicit (object oriented) syntax to avoid unexpected errors in plotting.